Weight at first calving; Age at first calving; First lactation milk yield; Herd life milk yield; Univariate and multivariate animal models
1 Introduction
A vast majority of buffaloes are low milk producers in India. Utilization of this large germplasm for its genetic improvement and better economic return with the help of modern scientific tool would be of great importance. Improvement in buffaloes can, therefore be brought about only through selection. A major objective for buffalo breeding is to enhance milk production for higher economic return. The efficiency of production of dairy buffalo depends upon optimum combination of productive and reproductive traits. Breeding techniques used in the dairy animal improvements are essentially for evolving and improving the breeds to our needs through selection and breeding. The choice of a criterion of selection depends on the heritability estimates, availability of the required information and the nature of traits under consideration. If the economic traits are to be included in a breeding programme, accurate estimates of breeding values will be needed to optimize selection programme. This requires knowledge of variance and covariance components (
Raheja et al., 2000). Traditionally, variance and covariance components were estimated by ANOVA and regression methods. Analysis of variance estimators such as Henderson’s method 1, 2 and 3 are appropriate in the data where some individuals lack records on some traits as a result of selection on one and other traits. The main assumption of random sampling underlying standard ANOVA type procedures does not hold true. Therefore, the estimates of variance and covariance obtained from these methods are expected to bias by selection (
Robertson, 1977;
Meyer and Thompson, 1984). The method of least squares (LS) analysis of variance based on paternal half-sib correlation has widely been used in India for estimating the variance components for animal breeding data.
In contrast, with the analysis of variance estimators, maximum likelihood estimators seem to be free of some forms of selection bias (
Schaeffer and Soong, 1979). Minimum Norm Quadratic Unbiased Estimation (
Rao, 1971) and restricted maximum likelihood (
Paterson and Thompson, 1971) can be used to account for all relationship (
Henderson, 1985) which results in an estimate that is less biased by selection and more precise than estimates obtained by traditional methods (
Keele and Harvey, 1989). An important advantage of REML, utilizing relationship is that the, assumptions that animals (sires) are unrelated and are non-inbred need not be made. Estimating covariance matrices on the basis of mixed model methodology has the basic advantage of using identical models in the prediction of genetic merit and variance component estimation for all possible models.
The objectives of this study were to compare different animal models used to estimate genetic parameters of productive and reproductive traits of Murrah buffaloes, using single trait analysis with models methodology. The aim was to have a better knowledge of genetic of these traits to choose the best model for each one of the traits which can be used as selection criteria.
2 Materials and Methods
The data spread over the period of 25 years for the present study. Data were obtained from the history sheets of 1 312 Murrah buffaloes maintained at four military dairy farms of northern India viz. Ambala, Agra, Lucknow and Bareilly.
The animals with known pedigree and complete records on all target traits viz. weight at first calving, age at first calving, first lactation milk yield, herd life milk yield (first three lactations milk yield), first lactation period, first dry period, first calving interval and first service period were considered for the present study. The sires with less than 4 progenies had been deleted from the analysis.
2.1 Statistical methodology
For the estimation of parameters and (co) variance components, least-squares analysis (LSA) and derivative free restricted maximum likelihood (DFREML) methods were employed. Data were subjected to LSMLMW and MIXMDL package of
Harvey (1990) under different models. Two models were considered to examine the effect of genetic and non-genetic factors on various first lactation traits and herd life milk yield. Model 2: The model 2 considered was from LSMLMW and MIXMDL package of
Harvey (1990) which consists one set of cross classified non-interacting random effect. All eight traits were analyzed simultaneously, the model is as follows:
yijklm=uc+si+Fj+pk+sl+eijklm
Where,
yijklm is observation on 1st progeny of ith sire of jth farm lth season in kth year.
uc is the overall mean.
si is the random effect of ith sire (i = 1, 2, ……, 122)
Fj is the fixed effect of the jth farm (j = 1, 2, …, 4)
pk is the fixed effect of kth period of birth (k = 1, 2, …, 5)
sl is the fixed effect of lth season of birth.
eijklm is the random error which is normally and independently distributed with mean 0 and variance σ2e.
The analysis was computed with the mixed model least squares program which utilizes the method 3 of
Henderson (1953).
Model 8 The model 8 considered was from LSMLMW and MIXMDL package of
Harvey (1990), non interacting random effect. The same model was fitted on all the traits and the traits were analyzed separately. The general formulation of the mixed model fitted is as follows:
yijklm= uc+ si+Fj+pk+sl+eijklm
Where, all the abbreviations are same as described in first model. The formulation of model in matrix notation is as follows.
Y=l uc+xb+za+e
Where,
l is the column vector of the means.
uc is an overall mean.
b is the column vector of fixed effects.
a is a column vector of random effect.
z is an incidence matrix of 0’s and 1’ s.
x is an incidence matrix of 0’ s, 1’ s and -1’s and x-x values for the discrete effects, and e is a column vector of the random errors.This model is same as first model, except the random effect may be correlated.
2.2 Univariate
In univariate analysis, all the traits under study were analyzed separately. The same model was fitted on all traits. The general formulation of the mixed model fitted is as follows:
yijklm=μ+Ai+Fj+pk+sl+eijklm
Where,
Ai is random effect of ith animal and all the other abbreviations are same as described in earlier models. The formulation of general single trait animal model is matrix notation is as follows:
y = xf+za+e
Where,
y is a vector of Nxl records,
f is a vector of fixed environmental effects of sex and year, and co variable was taken here.
a is vector of breeding values for additive direct genetic effects fitted which is random.
s is a N*N F design matrix for fixed effects with column ranks N*F*.
z is a N* NR design matrix for random animal effects, where z = 1, and e is a vector of N random residual errors.
2.3 Multivariate model
In multivariate analysis, all the eight mentioned traits were taken simultaneously for analysis. The multi-trait animal model used to estimate parameters could be represented as follows:
Yijklm=+Fi+Pj+Sk+Al+eijklm
Where, eijklm is the observation on the mth individual belonging to ith farm, jth period kth season and ith animal.
μ is the overall mean
Fi is the fixed effect due to ith farm (I = 1, 2, 3, 4)
Pj is the fixed effect due to jth period (1, 2, 3, 4, 5)
Sk is the fixed effect due to kth season (1, 2, 3, 4)
Al is the random effect due to animal.
eijklm is the random error which is normally and independently distributed with mean 0 variance σ2e.
The above multi trait animal model, in matrix notation, for 8 traits used, was
Y=Xb+Zu+e
Where,
Y is a vector of Nt* 1 of records (N number of animals with performance and t number of traits).
b is the vector of fixed environmental effects of farm (1, 2, 3, 4 period (1, 2, 3, 4, 5), season (1, 2, 3, 4). No co variable was taken here u is a vector of breeding values for additive direct genetic effects fitted which is random.
e is a vector of N random residual errors, and X and Z are incidence matrices relating the records to the effects of the model.The starting values of sig a and sig e for interactions were taken from the result of model 2 analysis. Assumptions of the model are:
E[y]=Xb
E[u]=E(e)=0
With variances
Var(μ)=G=A#G0
Var(e)=R=1#R0
Where,
Go is a matrix of covariance’s for additive genetic effect among traits.
Ro is a matrix of the residual covariance among trait.
1 represents identity matrix and # is Kronecker product.
3 Results and Discussion
The least squares means (±SE) estimated by model 2 and model 8 for different traits, have been presented in
table 1 and
table 2. The least squares means estimated by model 8 were slightly higher than the means estimated by model 2.The fixed effect of farm had significant effect on weight at first calving and first lactation milk yield under model 2 and weight at first calving, age at first calving, first lactation period, and first service period under model 8 analysis. Period of calving exhibited highly significant effect at (P<0.01) on age at first calving, first lactation period, first dry period, first lactation milk yield and herd life milk yield under model 2 and age at first calving, first lactation period, first dry period, first calving interval, first lactation milk yield and herd life milk yield under model 8 and significant effect (P<0.05) on first calving interval under model 2 and first service period under model 8 analysis. Season of calving exhibited significant (P<0.01) effect on age at first calving under model 2 and 8 and significant (P<0.01) effect on first lactation period under model 2 and model 8. The random effect of sires had significant effect (P<0.01) on age at first calving, first lactation period, first dry period, first calving interval, first service period, first lactation milk yield and herd life milk yield,. The least squares means in the present study were in close agreement with those reported by
Singh and Rathi (1991),
Singh et al.(1998);
Tiwanaet et al. (1998);
Dass and Sadana (2000),
Duttet et al. (2001);
Singh (2002);
Singh et al. (2004);
Suresh et al. (2004), and
Kumarveluet et al. (2006),
Yadavet et al.(2007), and
Singh and Barwal (2012).
The sire had accounted more variation under model 8 than model 2 for all traits, except first lactation period, first dry period and first calving interval. Sire of calf under model 2 of LS (
Table 3) accounted for 0.96% of total variation for body weight at first calving. The corresponding value under model 8 was 1.23% of total variation.
Sire of calf under model 2 (
table 3) accounted for 9.64% of total variation for age at first calving. The corresponding value under model 8 was 11.02% of total variation.
The sires had accounted more variation under model 8, than model 2 for age at first calving. Sire of calf under model 2 of LS (
table 3) accounted 3.5% of total variation for first dry period. The corresponding value under model 8 was 3.12% of total variation.
The sire had accounted more variation under model 2 than model 8 for first dry period. Sire of calf under model 2 L.S. (
table 3) accounted for 5.51% of total variation for first calving interval. The corresponding value under model 8 was 5.28% of total variation. The variation due to sire accounted similar observation under model 2 and model 8. Sire of calf under model 2 L.S. (
table 3) accounted for 4.44% of total variation for first service period. The corresponding value under model 8 was 3.56% of total variation.
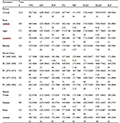
Table 1 Least squares means for WFC, AFC, FDP,FCI, FSP, FLMY, HLMY and FLP under model 2
|
The sires accounted for higher variation under model 2 than model 8 for first service period. Sire of calf under model 2 to LS (
table 3) accounted for 6.76 and 4.37% of total variation for FLMY and HLMY respectively. The corresponding values under model 8 were 7.00% and 4.38% of total variation.
The sire had accounted more variation under model 8 for FLMY and HLM. Sire of calf under model 2 of LS (
table 3) accounted for 6.45% of total variation for first lactation period. The corresponding value under model 8 was 6.01% of total variation. The sire had accounted more variation under model 8 than model 2 for body weight at first calving. Since all the traits were analyzed simultaneously under model 2, therefore, there may be some confounding among traits which decreased sire contribution in total variation with body weight at first calving. But that was not the case with model 8 as all the traits were analyzed separately.
.png)
Table 2 Least squares means for WFC, AFC, FDP,FCI, FSP, FLMY, HLMY and FLP under model 8
|
The variance components along with the heritability’s of the traits estimated with model 2, model 8, univariate and multivariate animal models are presented in
table 4,
table5,
table6,
table 7 respectively. Additive (direct), environmental and phenotypic variances estimated from univariate and multivariate animal models agreed closely for all the traits. Similarly variance estimated from model 2 and model 8 analyses agreed for environmental and phenotypic variance for all eight traits. Model 2 had slightly higher additive genetic variance for first lactation period, first dry period, first calving interval and first service period but lower for weight at first calving, age at first calving, first lactation milk yield and herd life milk yield, than model 8. Univariate animal model had slightly lower additive (direct) variance for weight at first calving and age at first calving than the values estimated under multivariate animal model. Higher additive covariance was estimated between weight at first calving and herd life milk yield followed by first lactation milk yield, whereas negative covariance was estimated between weight at first calving and age at first calving. First lactation milk yield had higher additive covariance with herd life milk yield. Additive covariance between age at first calving and herd life milk yield was higher followed by first lactation milk yield. The appropriate covariance should be used to ensure optimal accuracy in genetic evaluation because higher error variance for predicting genetic value increases the differences between true and estimated breeding value. These result were in close agreement with those reported by
Dass and Sadana (2000),
Dutt et al. (2001),
Singh et al. (2004),
Suresh et al. (2004), and
Kumarvelu et al. (2006),
Yadav et al. (2007), and
Singh and Barwal (2012).
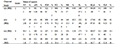
Table 3 Observed between and within sire variance (expressed as percentage of phenotypic variation) for WFC, AFC, FDP, FCI, FSP, FLMY, HLMY and FLP under model 2 and 8
Note: σ2 s=between sire, component of variance, σ2w=within sire component of variance PHS=Paternal half-sibs
|
.png)
Table 4 Estimates of variance components and heritability for WFC, AFC, FDP, FCI, FSP, FLMY, HLMY and FLP traits from model 2
|

Table 5 Estimates of variance components and heritability for WFC, AFC, FDP, FCI, FSP, FLMY, HLMY and FLP traits from model 8 of LSA
|
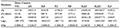
Table 6 Estimates of variance components and heritability for WFC, AFC, FDP, FCI, FSP, FLMY, HLMY and FLP traits from univariate REML analysis
|

Table 7 Estimates of variance components and heritability for WFC, AFC, FDP, FCI, FSP, FLMY, HLMY and FLP traits from multivariate REML analysis
|
The h
2 estimates for weight at first calving were 0.038, 0.39, 0.09 and 0.08 respectively under model 2 and model 8, univariate and multivariate REML analysis. The univariate and multivariate REML animal model estimated higher h
2 than the LSA methods. Because of its desirable properties, the univariate and multivariate animal model estimators were considered to be more appropriate than that of LSA method. The above differences observed among h
2 estimates may be due to the different methods applied in the present study. The low h
2 estimates of weight at first calving under different methods indicated the presence of non additive genetic variance in the herd. Therefore, weight at first calving may be improved through better feeding and management of the herd. The h
2 estimated by four methods for age at first calving were 0.39, 0.44, 0.32 and 0.27 respectively under model 2 and model 8 univariate and multivariate REML analysis. The moderate estimates of the heritability for age at first calving suggested that there is chance of selection of animals for age at first calving as sufficient amount of additive genetic variability exists in the herd and age at first calving could be reduced upto optimal level. The h
2 estimated by four methods for first lactation period were 0.26, 0.24, 0.18 and 0.20 respectively under model 2, model 8 univariate and multivariate REML analyses. The h
2 estimated by four methods for first dry period were 0.14, 0.12, 0.09 and 0.09 respectively under model 2, model 8 univariate and multivariate REML analyses. The low magnitude of h
2 clearly indicated that this is influenced by the environmental factors and this trait may be improve by better feeding and management practices. The h
2 estimated by four methods for first calving interval were 0.22, 0.21, 0.18 and 0.19 respectively under model 2, model 8 univariate and multivariate REML analyses. The h
2 estimated by four methods for first service period were 0.18, 0.14, 0.08 and 0.12 respectively under model , model 8 univariate and multivariate REML analyses. The lower estimates of h
2 for first service period reveal that all the variation in the first service period present are due to non-additive genetic causes, viz. management, nutrition and season etc. The h
2 estimated by four methods for first lactation milk yield were 0.27, 0.28, 0.23 and 0.22 respectively, under model 2 and model 8, univariate and multivariate REML analyses. The h
2 estimated by four methods for herd life milk yield were 0.18, 0.17, 0.19 and 0.19respectively under model 2, model 8 univariate and multivariate REML analyses. These results were in close agreement with those reported by
Suresh et al. (2004), and
Kumarvelu et al. (2006),
Dass and Sadana (2000),
Suresh et al. (2004),
Yadav et al. (2007), and
Singh and Barwal (2012).
Heritability (±S.E.) estimates for WFC, AFC, FDP, FCI, FSP, FLMY, HLMY and FLP traits from obtained by different methods are presented in
table 8. Estimates of heritabilities for FDP and HLMY from multivariate analysis were almost similar to h
2 estimates of univariate but slightly lower for WFC and FLMY. AFC had the highest h
2 estimates followed by FLMY (0.23), HLMY (0.19), FLP (0.18), FCI (0.18) and WFC (0.09) while FSP had lowest h
2 estimate under univaraite REML. Heritability estimated under multivariate REML analysis also displayed the similar tendency as h
2 estimates under univariates. The results revealed that the h
2 estimated under both models of REML were found almost similar or near to similar value.

Table 8 Heritability (±S.E.) estimates for WFC, AFC, FDP, FCI, FSP, FLMY, HLMY and FLP traits from obtained by different methods
|
Model 2 had higher h
2 estimates among all the four methods employed for all traits, except WFC, and FLMY.
Raheja et al. (2001) reported lower h
2 estimates by restricted maximum likelihood and maximum likelihood procedures than the paternal half sib based on least squares mixed model methodology for age at first calving (AFC) and first lactation milk yield (FLMY). Univariate and multivariate animal models had similar heritabilities for all trait except AFC but the heritabilities estimated by model 2 differ from model 8 for all traits, except WFC.
Raheja (1992) stated that the heritabilities calculated from use of residual and sire variances, obtained from single traits (Henderson Model 3) were over estimated by about 15-20%.
The heritabilities estimates under univariate are generally lower than estimates of model 8, except for WFC and HLMY. Higher h2 estimates for AFC, FLP, FDP, FCI, FSP and FLMY, under model 8 were observed than the univaritate animal model. The differences observed under different models could be due to model effect and factors considered under different models. The model 2 and model 8 used did not take in to account all relationship between animals but the animal model fitted does. Since sire was the random effect in model 2 and 8, using paternal half-sibs, therefore, there was no maternal effect included. Such types of paternal half sib’s estimates of h2 might be reduced due to selection of sires.
Henderson (1976) had shown analytically that ignoring some random effects in genetic evaluation can still result in unbiased estimates and predictions.
Meyer (1992), however, found that ignoring maternal effects tends to inflate direct h
2 estimates when using an animal model with real data. When the maternal variance components and the direct maternal covariance are not fitted in an animal model, this variation is included in the animal additive genetic components of variance. Out of 15 variance ratios obtained from DFREML, 5 were further away from the best solution than 0.03. Since the positive trait correlation has a direct physical origin, it might be expected that their variances, or at least their heritabilities, would show positive correlation (
Koots et al., 1994a).
The trend towards lower heritabilities for data from more recent years might indicate reduction in genetic variation caused by increased genetic phase disequilibrium due to increased selection intensity.
Using the estimates of heritabilities from animal models, one could expect improved rates of response by selection on additive genetic value. REML methodology combined the information from between and within lines, parent off-spring and the relationship between collateral relatives for an efficient estimate of response to selection (
Thompson and Atkins, 1990). If selection is to be made on direct effects alone, breeding value based on the estimates of the variance components under a sire model should be preferred. However,
Jain and Sadana (2000) reported that though the h
2 estimates under REML method were found lower than the estimates obtained under LSA method but the former were more reliable as they had similar S.E. of variance using REML procedure and preferable to those from an animal model accounting for direct effects only (
Raheja et al., 2001).
The standard errors of h
2 estimates under model 2 in general had higher standard error for all traits under the study and multivariate animal model had lowest, with same experimental data. The standard errors of h
2 estimates are an obvious criterion for comparing the precision, but not the bias of the estimation procedure (
Raheja, 1992).
The genetic and phenotypic correlations among various reproductive and productive traits are presented in
table 9. Genetic correlations of weight at first calving with all other traits were positive except with age at first calving which was highly negative. Environmental correlation of weight at first calving with first lactation period, first calving interval, first dry period, first calving interval, first lactation milk yield and herd life milk yield were negative and low while with age at calving, first dry period and first service period were positive. Phenotypic correlations of weight at first calving were positive with all the traits under study except between age at first calving and first lactation period.
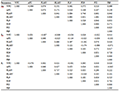
Table 9 Covariance matrices for WFC, AFC, FDP, FCI, FSP, FLMY, HLMY and FLP from model 2
Note: Where,a. Indicates direct additive genetic covariance; b. Indicates environmental covariance; c. Indicates phenotypic covariance
|
Genetic correlations of age at first calving with all other traits were positive and ranged from moderate to high. Environmental correlations of age at first calving with all other traits were negative and low except first lactation milk yield which was positive and low. Phenotypic correlations of age at first calving with all the traits were observed positive except first service period.
Genetic correlations of first lactation milk yield with all other traits were highly positive. Environmental correlations of first lactation milk yield with all other traits were positive except first dry period. Phenotypic correlations of first lactation milk yield with all other traits were positive.
Genetic correlations of herd life milk yield with all other traits were highly positive. Environmental correlations of herd life milk yield with all other traits were negative and low except first lactation period. The phenotypic correlations with all other traits were positive except first dry period.
Genetic correlations of first lactation period with FDP, FCI and FSP were highly positive. Environmental correlations with FDP, FCI and FSP were positive. Phenotypic correlation with FDP, FCI, FSP were highly positive.
Genetic correlation of first dry period with first calving interval and first service period were highly positive. Environmental and phenotypic correlations of first dry period with first calving interval and first service period were highly positive.
Genetic correlation between first calving interval and first service period was highly positive and environmental and phenotypic correlations of first calving interval with first service period were also highly positive.
4 Conclusion
Additive (direct), environmental and phenotypic variances estimated from univariate and multivariate animal models agreed closely for all the traits. Similarly variance estimated from model 2 and model 8 analyses agreed for environmental and phenotypic variance for all eight traits. Model 2 had slightly higher additive genetic variance than model 8. Univariate animal model had slightly lower additive (direct) variance than the values estimated under multivariate animal model.
Model 2 had higher h2 estimates among all the four methods employed for all traits. The heritabilities estimates under univariate are generally lower than estimates of model 8. Genetic correlations among different traits ranged from very low to very high under model 2. Phenotypic and environmental correlations also showed same trend.
Considering the statistics for the different reproduction and production traits of Murrah buffaloes, and the extent of genetic variance and co-variance in these characteristics, it appears that selection /culling should be done on the basis of REML (multi-traits) procedure.
Dass G., and Sadana., 2000, Factors affecting some economic traits in Murrah buffaloes, Indian Journal of Animal Research, 34(1): 43-45
Dutt T., Bhushan B., and Kumar S., 2001, Genetic parameters of first lactation performance traits in Murrah buffaloes, Indian Journal of Animal Science, 71(4): 394-395
Harvey W.R., 1990, User’s guide for LSMLMW and MIXMDL PC-2 version mixed model least squares and maximum likelihood computer program, Ohio State Univ, Columbus, USA, ARS
Henderson C.R., 1953, Estimation of variance and covariance components, Biometrics, 9: 226-252
Henderson C.R., 1976, A simple method of for computing the inverse of G numerator relationship matrix used in prediction of breeding values, Biometrics, 32(1): 69-83
Henderson C.R., 1984, Estimation of variance and co-variance under multi-trait models, Journal Dairy Science, 67: 1581-1588
Henderson C.R., 1985, MIVQUE and REML estimation of additive and non additive genetic variances, Journal of Animal Science, 61(1): 113-121
Jain A., and Sadana D.K., 2000, Heritability estimates under single and multi trait animal models in Murrah buffaloes, Asian Australian Journal of Animal Science, 13(5): 575-579
Keele J.W., and Harvey W.R., 1989, Estimation of components of variance and covariance by symmetric, Differences squared and minimum norm quadratic unbiased estimation: A comparison. Journal of Animal Science, 67(2): 348-356
Koots K.R., Gibson J.P., Smith C., and Wilton J.W., 1994a, Analyses of published genetic parameter estimates for beef production traits, 1. Heritability, Animal Breeding abstract, 62(5): 309-338
Kumaravelu N., Murugan M., Balagangatharathilagar M., Gopi H., and Sivakumar T, 2006, Study on the production and reproduction traits of murrah buffaloes in an organized farm in Tamil Nadu. Livestock International, 10(8): 4-6
Meyer K., and Thompson R., 1984, Bias in variance and covariance component estimaters due to selection on a correlated trait, Journal of Animal Breeding and Genetics, 101: 33-50
Raheja K.L., 1992, Selection free estimates of genetic parameters of production and reproduction traits of first three lactation in Murrah buffaloes, Indian Journal of Animal Science, 62(2): 149-154
Patterson H.D., and Thompson R., 1971, Recovery of inter block information when block sizes are unequal, Biometrika, 58: 545
Raheja K.L., Vinayak A.K., and Kalra S., 2001, Comparison of four methods of variance components estimation for heritability of economic traits in Murrah buffalo, Indian Journal of Animal Science, 71(2): 146-149
Raheja K.L., Vinayak A.K., and Kalra S., 2000, Genetic and phenotypic parameters estimated from singh and multi-trait restricted maximum likelihood procedure, Indian Journal of Animal Science, 70(5): 497-500
Rao C.R., 1971, Minimum variance quadratic estimation of variance components, Journal of Multivariate Analysis, 1: 445-456
Robertson A., 1977, The effect of selection in the estimation of genetic parameters, Journal of Animal Breeding and Genetics, 94: 131-135
Schaeffer L.R., and Soong H., 1979, Selection bias and REML variance covariance components estimation. Journal Dairy Science, 61: 91
Singh P.K, 2002, Genetic analysis of economic traits of Murrah buffaloes maintained at livestock farms of Uttar Pradesh, Indian Veterinary Medicine Journal, 26(1-3): 1-4
Singh C.V., and Barwal R.S., 2012, Use of different animal models in predictionon genetic parameters of first lactation and herd life traits of Murrah buffaloes, Indian Journal Dairy Science, 65(5): 1-6
Singh S., and Rathi S.S., 1991, Relationship among various reproduction and production efficiency traits in Murrah buffaloes, International Journal of Tropical Agriculture, 8(1): 93-99
Singh R.K., Singh B.P., and Singh M.R., 1998, Efficiency of economic traits using two methods for evaluation of Murrah Sire, Indian Journal Dairy Science, 51(3): 199-201
Singh S.K., Sharma R.K., Singh Harpal., Singh B., and Shukla A., 2004, Prediction of lifetime milk yield in Murrah buffaloes, Indian Journal of Animal Science, 74(1): 100-101
Suresh R., Bidarkar D.K., Ramesh Gupta B., Sudhakarrao B., and Sudhakar K., 2004, Production and reproduction performance of Murrah buffaloes, Indian Journal of Animal Science, 74(3): 315-318
Thompson R., and Atkins K.D., 1990, Estimation of heritability from selection experiments, In: Proc. 4th World Congress, Genetic. Applied to Livestock Production, 13, pp.257-260
Tiwana M.S., Dhillon J.S., Sethi R.K., and Jindal S.K., 1998, Genetic improvement of buffaloes producing under farm and field conditions, In seminar on problems of buffalo reproduction and their selections during October, 16, Souvenir pp.9-14
Yadav B.S., Yadav M.C., Singh A., and Khan F.H., 2007, Study of economic traits in Murrah buffaloes, Buffalo Bulletin, 26(1): 10-4

 Author
  Correspondence author